Will traditional statistical models be able to accurately predict the U.S election outcome this year?

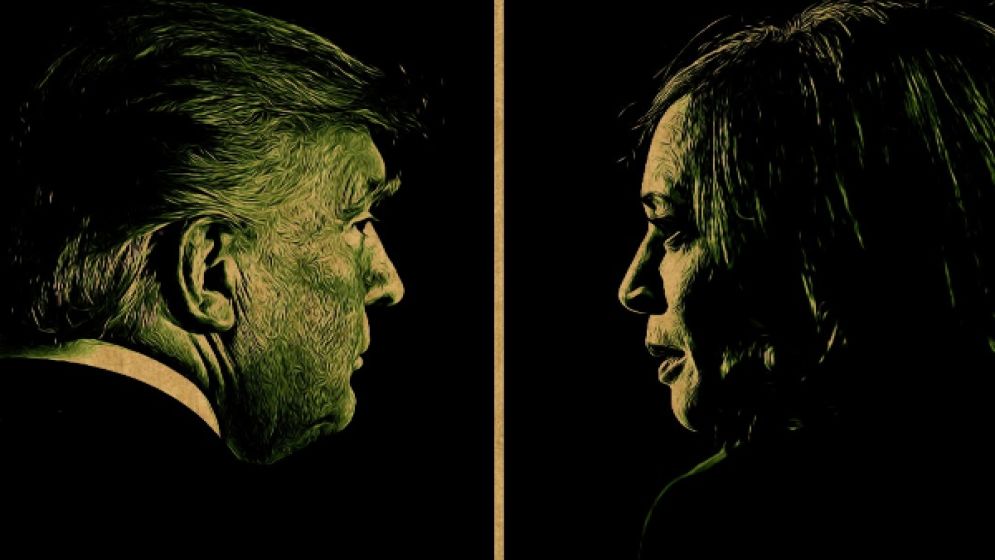
This year’s U.S. election is notable for several reasons. It kicked off with an unexpected change in candidates after the first debate between the octogenarian incumbent Joe Biden and his four-years-younger predecessor, Donald Trump.
If Vice President Kamala Harris, the Democratic Party's nominee, were to become the 47th President of the United States, it would be a historic milestone, marking the first time the world’s lone superpower elects a woman to the Oval Office.
There is a consensus that this election is closely contested, complex, and difficult to predict. Traditional statistical models for forecasting outcomes may not apply effectively this time.
National and battleground state polls for the upcoming November 5 election are extremely tight, suggesting that even minor changes in polling behavior could lead to significant shifts in winning probabilities and electoral college numbers.
A less-than-perfect alternative might involve supplementing these statistical models, which typically consider population variables, with counterfactuals that address complex systemic and structural issues, including economic factors.
Media outlets have largely focused on two main aspects: polling predictions and projected vote counts for each candidate nationwide.
However, historical evidence shows that polls often fall short by narrowing their focus to these two areas.
For instance, in 1982, polls anticipated a significant victory for Los Angeles Mayor Tom Bradley in his bid for Governor of California, but the actual outcome was very different. This discrepancy gave rise to the "Bradley Effect," raising questions about the accuracy of opinion polls.
Similar mismatches between polling data and actual election results have been observed in the U.S., India, and the U.K.
It's important to note that the U.S. president is not elected solely based on the national popular vote. According to the second clause of the first section of the U.S. Constitution, the Electoral College elects the president.
This body consists of 538 electors, which includes equal in number to congressional delegation (100 senators, 435 representatives) totaling 535 electors from the 50 states, and 3 from Washington D.C.
This analysis presents an updated version of the political demographic model I developed in 2020 to predict the outcome of the last U.S. election based on seven key factors.
While these factors remain significant, the complexities of this year's election prompt me to integrate additional factors and nuances to better understand the electoral landscape.

White Americans, education, and
geography factors
First, when excluding white individuals from Latin America, the overall number of white people in the U.S. has been declining.
The share of registered white voters has fallen from 85% in 1996 to 69% today. In contrast, the proportion of voters from other racial backgrounds is on the rise: Black or African Americans represent 11%, Latinos make up 8%, and individuals of Asian descent account for 6% of total voters.
Despite the decreasing percentage of white voters, they continue to play a significant role in determining election outcomes.
Since the 1930s, the Democratic Party has gained considerable prominence. During Roosevelt's rise, the Black population was relatively small.
It wasn't until the 1960s, amid the Civil Rights movement, that Black voters began to shift their allegiance toward the Democratic Party, with a majority supporting it today.
Previously, they had been aligned with Abraham Lincoln's Grand Old Party, highlighting a significant transformation in American political dynamics.
Secondly, while the U.S. excels in various fields of knowledge, a significant portion of the population—about two-thirds (65%) of registered voters—do not pursue higher education.
The percentage of registered white voters without a college degree has decreased from 45% in 1996 to 41%. Historically, a majority of educated individuals leaned toward the Republican Party, but this demographic has recently begun shifting toward the Democrats.
Thirdly, geographic factors have consistently played a significant role. Geography was pivotal during the creation of the U.S. Constitution.
States in the Sun Belt, such as Arizona, Georgia, and Texas, as well as those in the Rust Belt like Michigan, Wisconsin, and Pennsylvania—once known for their strong industrial bases but now facing deindustrialization—will significantly influence election results.

Women voters, crisis and religion
Fourthly, women generally participate in elections at higher rates than men, though factors like age, race, and education also influence female voters.
The current makeup of the Supreme Court has impacted the women’s movement, and discussions among suburban women have significantly shaped their voting behavior.
There has been a notable shift among young women leaning toward Democrats, while Republicans have increasingly attracted male voters, a phenomenon referred to as the “gender gap.”
Fifthly, major crises can profoundly affect elections. Statistics reveal that critical issues during election periods often determine outcomes.
For example, in 1928, humanitarian Herbert Hoover achieved a landslide victory with 444 Electoral College votes, gaining public support through his work on various commissions after World War I.
However, just four years later, in 1936, New York Governor Franklin D. Roosevelt won 472 Electoral College votes, while Hoover secured only 59.
Roosevelt's implementation of the New Deal allowed him to serve four presidential terms until the 22nd Amendment limited presidents to two terms.
Similar trends were observed in 1968 during the Vietnam War, with Ronald Reagan in 1980, and Barack Obama in 2008, who garnered support from a diverse coalition.
Regarding demographic shifts, the proportion of individuals aged 50 and over in the U.S. has increased from 44% to between 50-52%.
Meanwhile, the number of young voters is rising, although their enthusiasm for voting tends to lag behind that of older generations.
Typically, older white voters lean Republican, but the pandemic has notably affected their voting patterns. In contrast, younger voters are increasingly vocal about issues like healthcare access and free university education.
While socialism remains a sensitive topic in American society due to the legacy of McCarthyism, there is a growing leftist trend among younger voters, leading to higher electoral participation.
Lastly, despite modern states often emphasizing the separation of religion and politics, religion still plays a significant role in voting behavior.
About 60-64% of the U.S. population identifies as Christian. Although the percentage of Evangelical voters has declined from 21% to 18%, they continue to be a vital support base for Trump.

Factoring in the complex issues
It is however crucial to acknowledge the limitations of statistical models used for predicting outcomes. The 2016 presidential election serves as a notable example.
Poll-aggregating site FiveThirtyEight estimated Donald Trump's chances of victory at 30%, while The New York Times placed him at just 15%. In the end, Trump’s win made the 30% prediction appear more accurate, but it was merely one outcome among countless possibilities.
The difficulty obviously lies in the nature of the events being predicted. Frequent occurrences, like sports games or daily weather forecasts, provide ample data for researchers to evaluate the accuracy of their models, thanks to decades of historical records.
In contrast, events like presidential elections, which take place every two to four years, do not offer sufficient data for reliable assessments.
While past performance can help eliminate overly optimistic forecasts—such as those that granted Hillary Clinton a 99% chance of winning in 2016—we may need hundreds of years of electoral data to effectively distinguish between forecasts that remain within reasonable bounds.
Besides, in the past two decades, polls have proven less accurate when Donald Trump is on the ballot. Just as his 2016 victory shattered many norms, Trump's presence on the Republican ticket—despite facing four criminal indictments, multiple scandals, and years of unfavourable media coverage—defies conventional expectations.
In fact, the last time the S&P 500 didn't accurately forecast the next president was during the most recent election. After overseeing a 2.3% increase in the market, Trump ultimately lost to President Joe Biden.
This year, Trump's candidacy has again introduced several counterfactuals into election predictions. Take the influence of figures like Elon Musk and Jeff Bezos, for example.
Elon Musk has ventured into uncharted territory for a CEO by actively campaigning alongside Trump, celebrating onstage with him, amplifying controversial political rhetoric on social media, and even offering $1 million daily prizes to registered voters in swing states.
Conversely, The Washington Post's "unconventional" decision not to endorse a presidential candidate has shifted the political spotlight onto its owner, Jeff Bezos, leaving neutral observers of the election in a state of confusion regarding predictions.
However, Kamala Harris has secured endorsements from several prominent billionaires, including Bill Gates and Warren Buffett.
General voters concerned about the recent decline in inflation rates may also be inclined to support Harris, in what Bernard Yaros, lead economist at Oxford Economics, refers to as his "misery-index model."
This model is based on the misery index, an informal metric that combines the nation's unemployment rate with its annual inflation rate. Currently, the misery index stands at 6.5%, below its average of 9.1% since 1947.
Historically, the misery index has proven to be a reliable predictor of presidential outcomes, with higher index numbers suggesting that the incumbent party is likely to lose. For instance, the index hit 15% in 2020, indicating that President Trump was vulnerable in that election.
Overall, it looks like a tightly contested race, and I would place my bet on ushering in a new history, and new milestones in the USA.
—
Dr. Rashed Al Mahmud Titumir is a professor at the Development Studies Department of Dhaka University

